


Long-term growth at almost 3%. Per capita consumption at 21.5kg – among the highest globally. An economy ranked fifth worldwide. All with fewer people to buy. Report by Bruce Janda, ResourceWise’s Senior Consultant.
Japan’s shrinking and ageing population is several decades ahead of most other highly developed countries and Japan has also seen decades of very slow economic growth. Many of the tissue consumption trends seen in Japan could be expected to appear in other developed countries as population growth slows and goes into decline.
The country is known for the invention of the automated automatic all-in-one toilet with an automatic wash and dry cycle that eliminates the need for toilet paper. These toilets can be found in homes and high-end hotels. Now this trend has spread to Europe, which already had a culture of bidets. Automated toilets are also produced in the United States as this trend spreads to upscale homes in North America. This probably won’t become a replacement for toilet paper in high-traffic restrooms as the several extra minutes of sitting though wash and dry cycles would tend to slow toilet access.
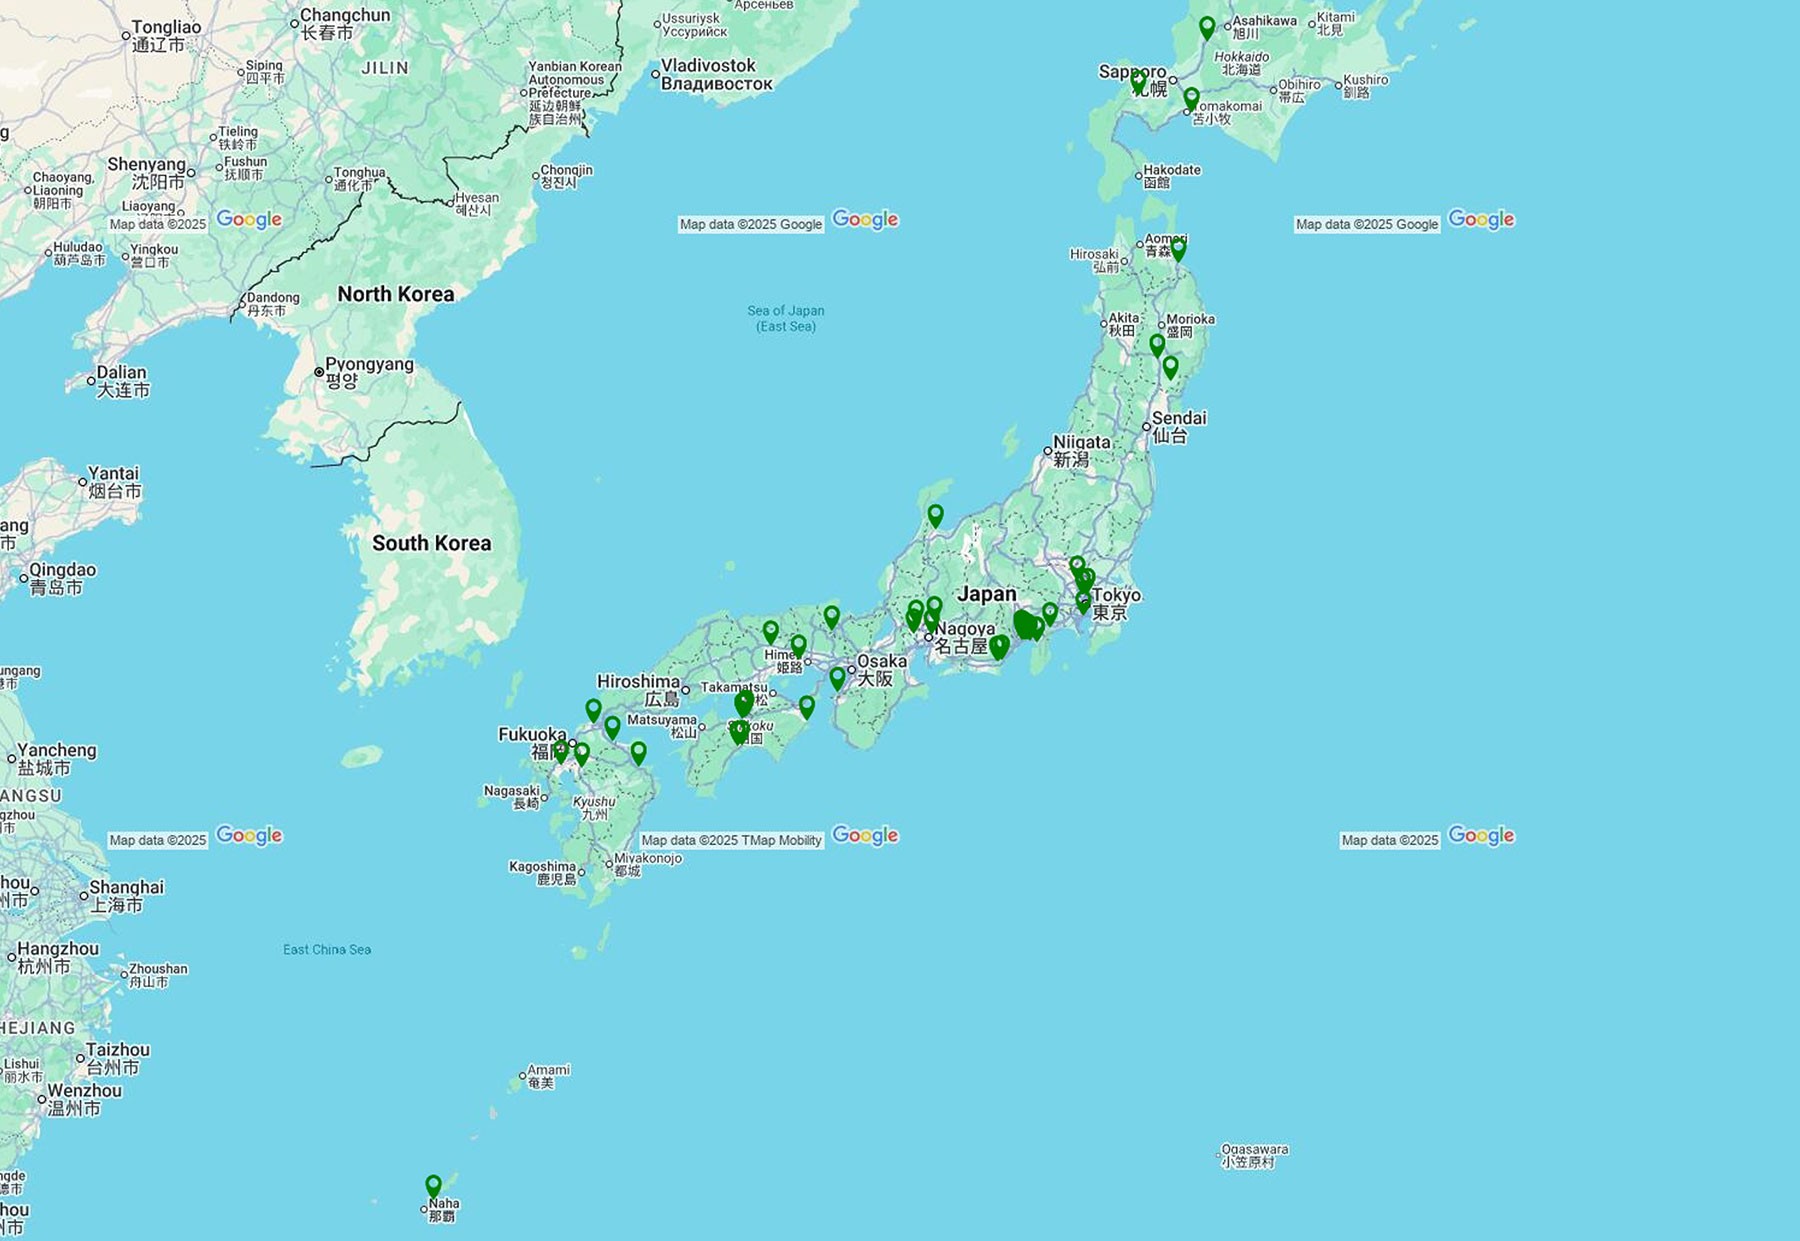
Japan’s tissue mills are spread across the Japanese Islands as shown in Figure 1. Note the proximity of South Korea, Taiwan, and Vietnam with Indonesia and the Philippines just below the map area shown.


Japan’s population decreased by -0.43% in 2024, ranking 218th out of 236 countries. Only a few other developed nations like Poland, Estonia, Latvia, and Lithuania are shrinking faster. Japan’s median age is 49.9, the third highest globally, making it a model for ageing societies.
Despite demographic decline, Japan’s wealth and GDP continue to rise, with real GDP per capita (PPP) showing strong growth. Japan ranks fifth worldwide in total real GDP.
Inflation and unemployment both affect tissue consumption. Figure 3 displays Japan’s inflation as a blue line, showing recovery after deflation and a post-pandemic increase. Unemployment, at about 2.6%, is low; youth unemployment was 3.9% in 2024 – much lower than in the US or Europe. With rising per capita tissue consumption outpacing population decline, Japan’s economy looks strong for continued domestic demand growth.
Figures 4 and 5 compare Japan’s tissue imports and exports. In 2024, imports exceeded exports by 20:1, up from 4:1 in 2007. Despite rising production, imports still far surpass domestic output. Per capita tissue consumption in 2024 was about 21.5kg, ranking among the highest globally.
Most imports come from China and Indonesia, with smaller quantities previously sourced from Vietnam, Malaysia, Canada, and the US. Exports mainly go to China, Hong Kong, Indonesia, Malaysia, and the Philippines.
Japan has nearly 190 tissue machines across about 80 sites, with major fleet changes occurring before the pandemic. From 2007 to 2025, total Japanese tissue production grew at a CAGR of 2.75%. Commercial tissue usage increased at 4.7%, outpacing consumer tissue’s growth below 2.5%. Although commercial tissue demand is rising with GDP per capita, it remains a smaller portion of overall consumption compared to North America and Europe.
Japan’s tissue market is fragmented, with no firm holding more than 13% share and many companies having just 1-2%.
Figure 8 shows that 60% of Japan’s tissue sites use recycled fibre from recovered paper, 7% are virgin integrated, and 32% are non-integrated.
Figure 9 displays the types of fibres used in different Japanese tissue products. Most production focuses on consumer bath tissue, which uses eucalyptus, southern hardwood, southern softwood, and a substantial amount of recovered fibre. Consumer facial tissue is the next largest category, mainly consisting of eucalyptus fibre.
Japan’s tissue machines were benchmarked against those from China, Indonesia, Taiwan, South Korea, Vietnam, and the United States. Figure 10 shows that China’s machines are newest; Indonesia, South Korea, and Taiwan operate at higher speeds than China. Although older, US machines are fastest on average. Japan’s lower average machine speed suggests less advanced technical capability.
Figure 11 compares average tissue production costs by country, showing cash cost per ton (bar height) and tissue capacity (bar width). Indonesia, Vietnam, and South Korea have the lowest costs, while Japan’s high energy expenses place its average cost above China but below the US and Taiwan.
Figure 12 illustrates the relative average viability of the comparison country set of tissue machines. The FisherSolve Next algorithm utilises estimated capital requirements, cash production costs, machine size, technical age, grade risk in the local economy, internal company risk, manufacturing competitiveness of the area, tons per unit trim, and export destination charges. Japan has significantly lower viability scores for their tissue capacity followed by Taiwan and South Korea. Indonesia, Vietnam, and the United States hold the most viable positions, followed by China. Japan’s high technical tissue machine age is a major issue.
Figure 13 shows Scope 1 (on-site fuel) and Scope 2 (electricity) carbon emissions per ton of finished tissue. Japan’s emissions are low, slightly higher than Indonesia’s, mainly due to different sources: Indonesia has lower on-site fuel emissions, while Japan benefits from a cleaner power grid. China and the United States have the highest emissions per ton.
Summary
Japan’s tissue demand continues to grow despite a shrinking population. Gains in personal income continue to drive tissue consumption rates.
The document compares Japan’s tissue industry with competitors and customers in China, Indonesia, Taiwan, South Korea, Vietnam, and the US.
Japan’s tissue machines are older and run at lower average speeds, indicating less advanced technical capability.
Production costs in Japan are higher than in Indonesia, Vietnam, and South Korea, mainly due to elevated energy expenses; Japan’s cost is above China but below the US and Taiwan.
Viability scores of Japanese tissue machines are lower than those in most other countries, largely because of ageing infrastructure; Indonesia, Vietnam, and the US are most viable, followed by China.
Japan maintains relatively low carbon emissions per ton of finished tissue, slightly higher than Indonesia, thanks to a cleaner power grid; China and the US have the highest emissions per ton.
A detailed understanding of tissue producers and their individual machines is crucial for analysing the competitive landscape. This article presents an overview of the current tissue industry in Japan. Fluctuations in fibre prices, exchange rates, and environmental regulations create both opportunities and challenges for industry participants. Moreover, changes in ownership and consolidations are expected to persist among tissue mills in Japan, while investments in tissue-making capacity from neighbouring countries may impact imports and exports.


